
Figure. 1 Display of Emerson's position from his PredictWind tracking display, with a model wind and pressure forecast.
That report is being executed via a PredictWind app (PW) in an iPad connected to an Iridium Go (GO) satcom transceiver with wireless router. The GPS position is being transmitted automatically from the GO every hour to a PW website that is linked to from Jacob's webpage. These positions are updated at 43 min after each hour and labeled with that time, but the actual position shown is from an earlier time, most likely near the whole hour.
The course indicated for the vessel is the direction from the previous position to the latest position, and the speed shown is the distance between these two points divided by one hour. Unfortunately, both of these (CMG and SMG) are not correct. The actual vessel track does not zig-zag around as much as shown in this plot. The track errors are the result of GPS position errors, which we have traced to an unusual situation in this equipment.
To get best satcom reception, GO units usually employ and external antenna so the actual unit can remain safely below decks. This greatly improves the satcom signals, but unfortunately the GPS antenna used for the position reports is not in that external antenna; it is in the stubby antenna right on the GO box, which is below decks, under a large layer of solar cells that block the GPS signals. Consequently, the GPS in the GO is only seeing a slice of the horizon, which is changing frequently as the boat responds to the waves with roll and pitch and yaw. In short, the fixes have poor accuracy and since they are so close together (on average about 1.5 nmi), the range and bearing between them have even larger errors.
To compensate for this on some level, we have tapped into these position reports to make our own tracking system and in our presentation we make a sliding average over the past 3 hr. So the position you see in our report at say 1200 is the average of what was reported at 1200, 1100, and 1000. This gives us a better measure of his actual progress, meaning course and speed made good. We also show one position each hour and mark the one nearest to 00z in red. Thus the distance between successive red markers is his 24 hr progress. Below is a sample, then we explain how to get the full data set to view in Google Earth.
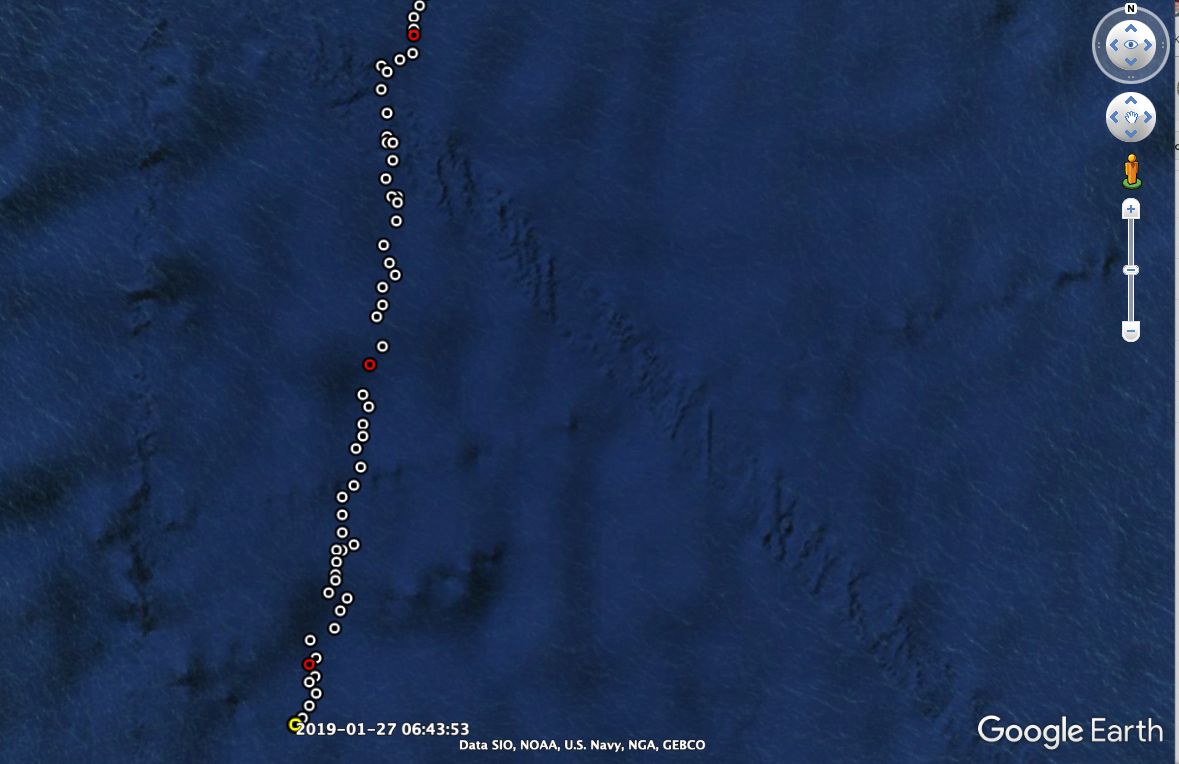
Figure 2. Jacob track viewed Google Earth. Individual points added each hour are a sliding 3-hr average. Red positions are near 00z, about 24 hr apart. A cursor roll over shows time and date
We have compiled these positions into a KML file that can be viewed on Google Earth (GE), along with other features that help followers monitor his progress and the environment he is traversing.

Figure 3. The black marks are hourly positions; red line is the rhumb line HI to Cairns; white lines mark the north and south limites of the countercurrent in Jan according to the Pilot Chart; green is the same limits for February.
He is just emerging from the region of the predicted countercurrent flowing to the east, and we are trying to figure out now if the bend of his course to the east is a result of such a current. More on this shortly. See our note on the countercurrent. The ocean current model (RTOFS) do not show such a drift, and the OSCAR model which was a promising way to look at this, unfortunately packed it up for the government shut down just at the wrong time for us.
We also overlay the ASCAT satellite winds. A sample is below. We typically get good data at least once a day but sometimes the active path misses the boat.

Figure 4. Ascending pass of ASCAT-A at 2123z on Jan 26.
We will explain the above data and others that are included in a forthcoming video. Watch this article for an announcement.
This is not at all in final form, but you can download the KML file and start to use it from
With GE installed on your computer you can download the file, then click again to install the data into GE. It is not yet clear if this will work best saved to your places and then updating the individual parts, or just don't save when you close, and download it again when needed.
We have to see how this interacts with the online version of GE compared to the stand alone programs.
Below is a video outlining several of the KML overlays.
Later we will add videos with more details on the specific data sets and navigational matters.
For now, please post questions in the comments and we will try to help. In principle most functions work. We are doing the RTOFS forecasts manually using LuckGrib, which we will update every few days till we figure a way to automate it, and the OSCAR currents are still on government leave. I hope they get back online sometime soon. They are a 10 day average, so we might have to wait 10 days, even if they are back to work. We will also later add an index to the various data options included in the KML.
No comments:
Post a Comment